
Wondering how satisfied workers are with their jobs?
Or which jobs have the highest satisfaction?
To find out about these and more statistics on job satisfaction continue reading this article!
Here is what you can find out about:
- Employee Satisfaction Statistics
- Career Satisfaction Statistics
- Job Satisfaction Statistics By Profession And Industry
- Job Satisfaction Statistics By Country
The Most Interesting Stats On Job Satisfaction (Editor’s Pick)
- The mean of job satisfaction worldwide is 7.1.
- American workers (49%) are very satisfied with their jobs.
- 52% of full-time workers are satisfied with their jobs.
- Americans (52%) get a sense of identity with their jobs.
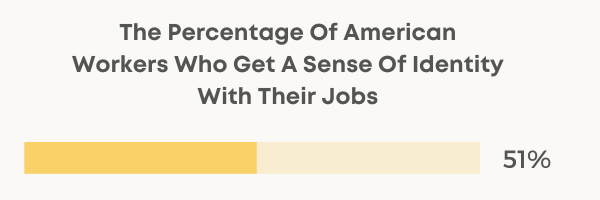
- 51% of American workers think of their job as a career.
- Remote workers (57%) report satisfaction with their jobs.
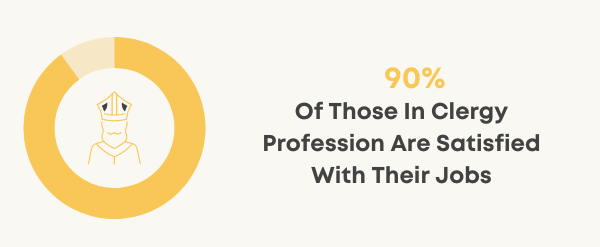
- 90% of clergy workers are satisfied with their jobs.
- Recruiting managers report the highest job satisfaction rate.
- 89% of Indian workers are happy with their jobs.
- 64% of UK workers are happy with their jobs.
Employee Satisfaction Statistics
1. In 2021, the mean of job satisfaction is 7.1 worldwide.
According to the Global Employee Engagement Index, the mean of job satisfaction worldwide is 7.1 in 2021.
Source: Ipsos
2. Almost half of the American workers (49%) say they are very satisfied with their jobs.
While 49% of American workers say they are very satisfied with their jobs, 30% are somewhat satisfied, under one in 10 are somewhat dissatisfied (9%), and 6% are very dissatisfied, according to American job satisfaction statistics.
Source: Pew Research Center
3. 59% of those who have an annual family income of $75,000+ are very satisfied with their job.
While those with an annual family income of 75 thousand dollars or more are very satisfied with their jobs (59%), almost five in 10 (45%) of those who have an annual family income of 30 thousand to 74,999 dollars are also very satisfied with their jobs. In comparison, 45% of those who have an annual family income of under 30 thousand dollars are also very satisfied with their jobs.
Source: Pew Research Center
4. 62% of those working in management report they are very satisfied with their jobs, compared to 48% of those working in manual or physical labor.
Employees working in some jobs are more likely to report job satisfaction, such as those working in management (62%). On the other hand, manual and physical labor workers only report 45% of job satisfaction.
Source: Pew Research Center
5. Full-time job workers (52%), salaried position workers (58%), and permanent position workers (53%) are more likely to report they are satisfied with their jobs.
When it comes to being satisfied with jobs, those who have full-time jobs (52%), salaried positions (58%), and permanent positions (52%) are usually more satisfied than other workers.
Source: Pew Research Center
6. Around half of employed Americans (51%) say that they get a sense of identity with their jobs.
On the other hand, for 47% of American workers jobs are just something they do to make a living. This is also connected to the workers’ level of education. Those with a postgraduate degree (77%) say their job gives them a sense of identity, compared to 48% of those with some college education. Moreover, only 38% of those with a high school diploma or less say the same.
Source: Pew Research Center
7. Workers with a family income of over $75,000 or more (60%) report a sense of identity from their job, compared with 37% of workers with a family income under $30,000.
Those with a higher family income are more likely to view their job as a sense of identity than those with a lower family income. Similarly, 75% of workers with higher income ($75,000 or more) see their job as a career. On the other hand, so do 49% of those who earn between $30,000 and $74,999, and 17% of those who earn less than $30,000.
Source: Pew Research Center
8. Government workers (67%), non-profit organization workers (65%), and self-employed workers (63%) get a sense of identity from their job.
In comparison, only 42% of those working for private companies say it, too, according to U.S. job satisfaction statistics.
Source: Pew Research Center
9. Black workers are twice as likely to have bad jobs than white workers.
Compared to white workers, black employees are twice as like to have a bad job, especially black working women.
Source: Gallup
10. 79% of American workers believe company culture is the biggest contributor to job satisfaction.
For 79% of American workers, company culture is the key to feeling satisfied at work.
Source: Speakap
11. New technology is contributing to job dissatisfaction for 79% of American workers.
According to job dissatisfaction statistics, new technology contributes to job dissatisfaction for almost eight in 10 US workers.
Source: The Economic Times
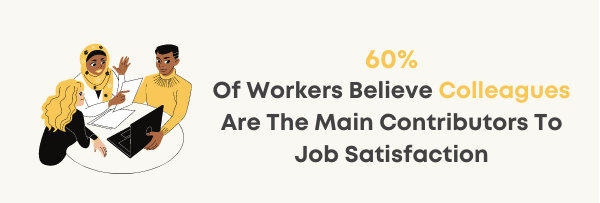
12. The main contributor to job satisfaction is colleagues for 60% of workers.
More than half of the respondents of a job satisfaction survey show that colleagues are the main reason why they are satisfied with their jobs.
Source: Statista
13. Companies with high satisfaction overperform companies with low satisfaction by 202%.
For workers to perform on a satisfying level, companies have to work towards giving their workers a reason to be satisfied with their jobs, as they can then outperform companies with low satisfaction by a whopping 202%.
Source: Gallup
Career Satisfaction Statistics
14. Only 26% of workers aged 18 to 29 see their job as a career, and 41% describe it as a stepping stone to their future careers.
It turns out, younger workers mostly view their jobs as a stepping stone to a career and not a career itself, according to career happiness statistics.
Source: Pew Research Center
15. 80% of full-time workers are satisfied with their work schedules, as well as 64% of part-time workers.
Only 20% of full-time workers say they would prefer to work part-time. In comparison, 36% of part-time workers say they would rather work full-time. Out of those part-time workers who would want to work full-time, 44% are parents with children under the age of 18.
Source: Pew Research Center
16. 20% of American workers report being passionate about their jobs.
While the same job happiness statistics data shows that 65% of US workers are satisfied with their jobs, only 20% say they are passionate about their jobs.
Source: Harris Interactive
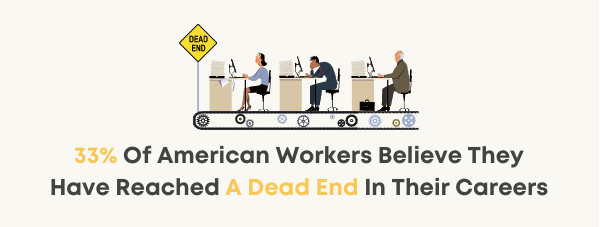
17. 33% of American workers believe they have reached a dead-end in their careers.
Not everyone feels happy and satisfied with their current jobs. In fact, one in three workers in the US feels like they have reached a dead-end in their career.
Source: Harris Interactive
18. Around one in five employees are eager to change their jobs and careers.
Only around 21% of employees aren’t happy with their jobs and careers are going and would like to change that.
Source: Harris Interactive
19. Less than half of millennials (45%) are satisfied with their careers and job paths.
While 65% of millennials can’t say the same, 45% are completely satisfied with their careers and job paths. Moreover, almost half (49%) are not happy with development programs at their current company.
Source: LaSalle Network
20. About half of the American workers (51%) say they view their jobs as a career.
In comparison, 18% of them see their job as a stepping stone for their career, while 30% see their jobs as just something they do to get them by.
Source: Pew Research Center
21. Those with an undergraduate degree or more are twice more likely to say their job is a career than those with less education.
Workers who have an undergraduate degree or more (70%) report their jobs as a career, compared with 44% of workers who have some college education, and 39% of those without a college education.
Source: Pew Research Center
22. Government workers (66%), self-employed workers (63%), and non-profit organization workers (56%) say their job is a career.
On the contrary, only 44% of those who work for private companies say the same.
Source: Pew Research Center
23. Health care workers (62%) and education workers (70%) get a sense of identity from their jobs.
On the other hand, only 42% of hospitality workers and 36% of retail or wholesale workers say the same.
Source: Pew Research Center
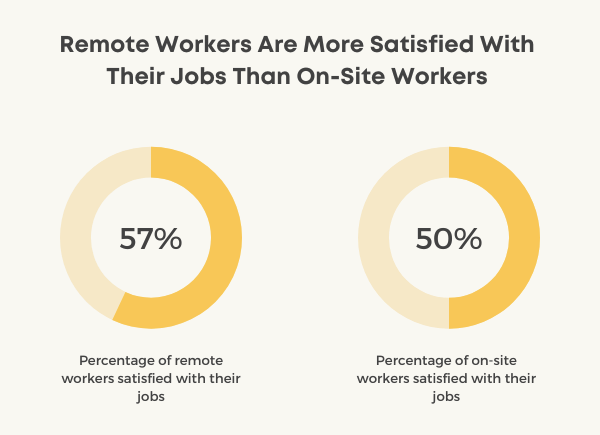
24. Remote workers (57%) are more satisfied with their jobs than in-office workers (50%) during the pandemic.
During the pandemic, those working from home (57%) were slightly more satisfied with their jobs than those who had to work on-site (50%), according to job satisfaction rates and remote work statistics.
Source: CNBC/Survey Monkey
25. The highest rate of job satisfaction (56.9%) in the last 20 years was recorded in 2020.
Compared to 2010 when the job satisfaction rate was 42.6%, it climbed to a 20-year high in 2020 (56.9%), despite the start of a global pandemic.
Source: The Conference Board
26. Trust between the employee and management plays a key role in job satisfaction for 61% of workers.
To have a higher rate of job satisfaction, 61% of employees believe that there has to be trust between them and the management. However, only one in three American workers say they are happy with their relationship with their managers.
Source: SHRM
27. Only 9% of US workers scored the highest mark on Workplace Happiness Index.
Less than one in 10 American employees scored the highest score on the Workplace Happiness index, according to job happiness statistics. As a result, only a small portion of all the workers in the United States are happy with their jobs.
Source: CNBC
28. The cost of unhappy US workers is estimated at up to $550 billion a year.
Unhappy and unsatisfied workers are less productive and more likely to leave, which costs companies between $450 and $550 billion every year.
Source: Gallup
Job Satisfaction Statistics
By Profession & Industry
29. In 2019, 90% of employees in the clergy profession were satisfied with their jobs.
According to stats on job satisfaction, nine in 10 clergy employees reported feeling satisfied with their jobs.
Source: PayScale
30. Software developer, dentist, and physician assistant were top jobs in the US in 2020.
Job satisfaction rates show that top jobs in the US in 2020 were software developer, dentist, and physician assistant jobs.
Source: US News
31. Out of those who work in legal jobs, 81% find it boring.
Interestingly enough, only 19% of those who work in legal jobs did not say they find their job boring, according to job satisfaction statistics by profession.
Source: Wise Step
32. Recruiting managers report the highest job satisfaction rating.
Recruiting managers scored a 4.6 out of 5 rating on job satisfaction, according to statistics on job satisfaction by career. According to this, human resources offer one of the highest job satisfaction by industry.
Source: Glassdoor
33. One of the highest-scored satisfying careers is that of a video game creative director.
According to workplace satisfaction statistics, video game creative director scores a rating of 4.5 out of 5, making it one of the most satisfying professions.
Source: CareerExplorer
34. Among the best-paid jobs, the product designer is the most satisfying profession.
Scoring 3.8 out of 5, product designers are the most satisfied with their jobs out of all the best-paid jobs, according to job satisfaction vs money statistics.
Source: PayScale

35. Surgeons have a 96% score when it comes to the most meaningful jobs.
While 96% of surgeons say that their jobs are very meaningful, they also have the highest median pay of $304,000.
Source: PayScale
36. Workplace Happiness Index jumped from 71 in 2019 to 73 in 2020.
Despite the pandemic, workers are happier with their jobs in 2020 than they were in 2019. Since then, it has gone down to 72 out of 100 in April 2021.
Source: CNBC/Survey Monkey
37. Those working in education administration, elementary, and secondary schools have a high satisfaction rate of 88%.
Moreover, they also have a high meaning rate of 95%, according to education job satisfaction statistics. According to job satisfaction statistics by industry, education is one of the industries with the highest satisfaction rate.
Source: PayScale
38. 86% of radiation therapists record a high satisfaction rate with their jobs.
For 86% of radiation therapists, this job has a high satisfaction rate. Likewise, for 93% of them, it also has a high meaning.
Source: PayScale
39. 88% of pediatricians record a high satisfaction rate.
Doctors taking care of children score a very high job satisfaction rate of 88%, according to PayScale.
Source: PayScale
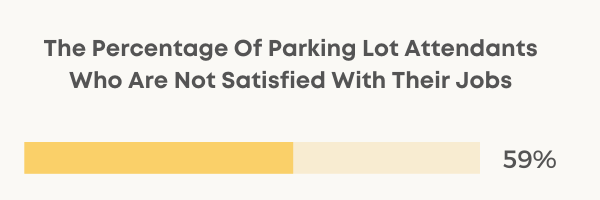
40. 41% of parking lot attendants report a high job satisfaction score.
Moreover, they also record only 5% of the high meaning job rate.
Source: PayScale
41. Only 41% of crushing, grinding, polishing machine setters, tenders, and operators are satisfied with their jobs.
Just over four in 10 of those who are setting, tending, and operating crushing, grinding, and polishing machines say they are happy and satisfied with their jobs.
Source: PayScale
42. 90% of American teachers say they are satisfied with their jobs.
This finding of teacher job satisfaction statistics in the US is in line with the rest of the world. However, only 36% of teachers think that society values the teaching profession.
Source: Brookings Institution
43. Lawyers rate their job happiness at 2.6 out of 5.
Lawyers are among the least satisfying professions in the US. They rate their job happiness at 2.6 out of 5, putting them in the bottom 7% of careers, according to lawyer job satisfaction statistics.
Source: CareerExplorer

44. Nurses report a job satisfaction rate of 94 to 98%, depending on the position they work at.
Nurses are very happy with their jobs, reporting a high satisfaction rate of 94 to 98%, according to nursing job satisfaction statistics.
Source: Medscape
Job Satisfaction Statistics By Country
45. Indian workers (89%) are the happiest and most satisfied with their jobs in the world.
World job satisfaction statistics show that Indian workers are the happiest on the planet (89%).
Source: Randstad
46. Japanese workers are some of the least satisfied in the world.
According to the Randstad Workmonitor job satisfaction statistics by country, under half of the Japanese workers (42%) feel satisfied with their jobs.
Source: Randstad
47. Mexico, the US, China, the UK, and Germany all have a job satisfaction rate between 71 and 85%.
After India with 89%, Mexico has an 85% job satisfaction rate. The US has a 78% job satisfaction rate, followed by China at 74%. Also, the UK has a job satisfaction rate of 74%, and Germany has a rate of 71%.
Source: Randstad
48. In Australia, 44% of workers are extremely or very satisfied with their jobs.
Eleven percent of workers are extremely satisfied with their jobs, 33% are very satisfied, and 42% are somewhat satisfied, according to job satisfaction statistics for Australia.
Source: Converge International
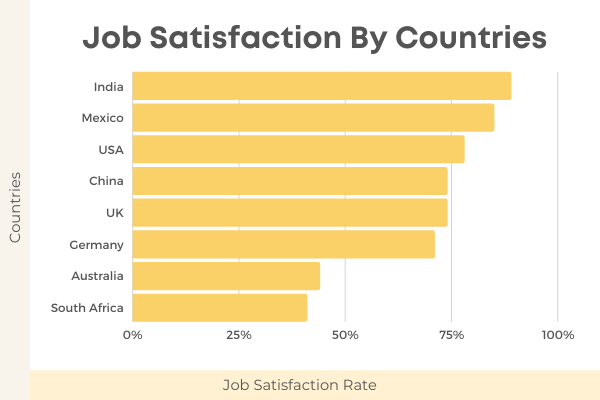
49. 41% of workers in South Africa are satisfied with their jobs.
According to job satisfaction statistics in South Africa, only around four in 10 employees (41%) are satisfied with their jobs.
Source: Accenture
50. More than six in 10 UK workers are satisfied with their jobs.
According to the UK job satisfaction statistics, 64% of their workers are satisfied and happy with their jobs.
Source: Amanet
51. Compared to 2016 when the job satisfaction rate was 74%, the rate fell by 10% in 2019 in the UK.
While job satisfaction in the UK had a rate of 74% in 2016, it fell by 10% in the following three years.
Source: Amanet
Final Verdict
To sum everything up, statistics on job satisfaction tell us that many workers are happy with their jobs, while some may not be, as much. Moreover, job satisfaction is in the perception of individuals. However, we can conclude that some professions and industries usually have a higher satisfaction rate than others.