
Entrepreneur statistics demonstrate how big the population of entrepreneurs is, as well as many other interesting figures.
These figures are good to consider for those who want to go down the entrepreneurship road. While it comes with many risks and obstacles on the way to success, it can also be very rewarding. Moreover, entrepreneurs and startups are important for the economic growth of countries.
Which good and bad news are there about entrepreneurs at the moment? We shall find out in this article about entrepreneur stats.
Let’s start!
Here is which stats and figures you can find out about:
- Female Entrepreneurship Statistics
- Black Female Entrepreneurs Statistics
- Male Entrepreneurs Statistics
- Entrepreneur Age Statistics
- Black Entrepreneurship Statistics
- Entrepreneurship Statistics Worldwide
- Entrepreneurship Growth Statistics
- Millennial Entrepreneurs Statistics
- Young Entrepreneurs Statistics
- Entrepreneur Mental Health Statistics
- Entrepreneur Burnout Statistics
- ADHD Entrepreneur Statistics
- Entrepreneur Income Statistics
- Entrepreneur Statistics UK
- Entrepreneur Statistics Canada
- Entrepreneur Depression Statistics
- Percentage Of Entrepreneurs That Fail And Succeed
Key Entrepreneur Statistics
(Editor’s Pick)
- For 10 male entrepreneurs, there are seven female ones.
- Globally, there are 252 million female entrepreneurs.
- 46% of black entrepreneurs are women.
- Out of all small business owners, 68% are men.
- Baby Boomers make 41% of small business owners.
- 5.88 million entrepreneurs are under 35 years of age.
- Out of all US entrepreneurs, 13% are Millennials.
- Mental health problems affect 72% of entrepreneurs.
- 50% of business founders report feeling burnt out.
- The average US entrepreneur makes $61,000 annually.
- 20% of new businesses fail within the first two years.
Female Entrepreneurship Statistics
1. For every 10 male entrepreneurs, there are seven female entrepreneurs.
Worldwide, the ratio of male and female entrepreneurs is 10 to seven. However, in some countries in the world, there is the same number of entrepreneurs – Panama, Qatar, Madagascar, Angola, Indonesia, Thailand.
Source: Babson
2. Female entrepreneurs hire around eight people, compared to males who hire around 12.
According to the Office of Advocacy, there is a difference in how many employees are hired by females and how many by male entrepreneurs. It turns out, male entrepreneurs hire around 12 employees on average, while females hire around eight people on average.
Source: Office of Advocacy
3. In 2019, there were 13 million women-owned businesses.
While there are more male than female-owned businesses in the United States, the number of the latter is on the rise. In 2019, according to American Express, there were 13 million female-owned businesses.
Source: American Express
4. There are 252 million female entrepreneurs worldwide.
According to the Global Entrepreneurship Monitor for 2019/2020, there are 252 million female entrepreneurs worldwide. Moreover, data from Babson discovers that the rate of female entrepreneurial activity rose to an average of 10.2% in the last years.
Source: Babson
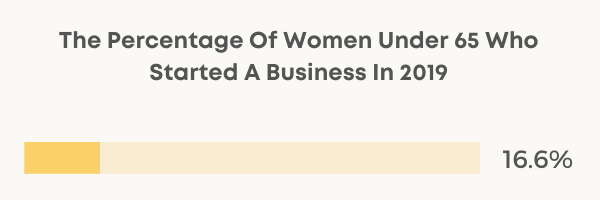
5. In 2019, 16.6% of US women under 65 started a new business.
The number of women under 65 who start a business in the US is smaller than the number of men. According to Babson’s Global Entrepreneurship Monitor, 16.6% of US women under 65 started a new business in 2019. In comparison, 18.3% of men in the same group age started a business in 2019.
Source: Babson
6. 65% of women say they start a business to earn a lot or build wealth.
There are different reasons as to why women start a business. For example, 65% of them start a business to earn a high income or to build wealth. Moreover, 45% become entrepreneurs because jobs are scarce. Also, 29% of female entrepreneurs start a business to continue a family tradition. Finally, 71% of females become entrepreneurs to make a difference in the world.
Source: Babson
7. In the US, between 2014 and 2019, women-owned businesses increased the total number of their employees by 8%.
According to American Express’ data for the period between 2014 and 2019, female-owned businesses increased the total number of their employees by 8%. In the same period, the increase among all businesses was only 1.8%.
Source: American Express
8. Between 2014 and 2019, the number of US women-owned businesses rose by 21%.
In five years between 2014 and 2019, the number of female-owned businesses rose by 21% in the United States. In comparison, the number of all businesses grew by only 9%.
Source: American Express
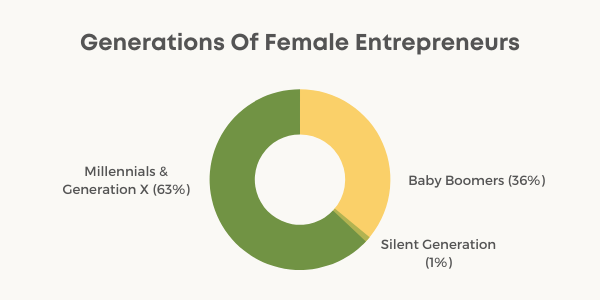
9. Over one in three US female entrepreneurs are Baby Boomers (36%).
More than one-third (36%) of female entrepreneurs in the United States belong to the generation of Baby Boomers. On the other hand, 1% are Silent Generation. Moreover, 63% of them are Millennials or Generation X.
Source: Guidant Financial
10. The most popular female-owned and female-led industry is retail (16%).
According to Guidant Financial, retail (16%) is the most popular female-owned and led industry. Second of all is health, beauty, and fitness services at 13%. Also, popular female-owned and female-led industries are business services (11%), food and restaurant (10%), and residential and commercial services (7%).
Source: Guidant Financial
11. Out of all small business owners in the US, 27% are female.
According to Guidant Financial, just over one in four US business owners (27%) are female. This means that male small business owners still make up for the vast majority.
Source: Guidant Financial
12. American women started an average of 1,817 new businesses per day in 2019.
When it comes to 2019, it was a very successful year for female entrepreneurs. According to American Express, American female entrepreneurs started 1,817 new businesses per day on average in 2019.
Source: American Express
13. In the US, female entrepreneurs earn 28% less than male entrepreneurs.
Just like in most cases when it comes to the difference between female and male earnings, female entrepreneurs earn less than male entrepreneurs. Namely, according to FreshBooks, female entrepreneurs earn 28% less than male entrepreneurs.
Source: FreshBooks
14. Almost four in 10 female business owners (38%) used cash to start their business.
There are different ways of starting a business, from savings, cash, investments, loans, and more. According to Guidant, 38% of female business owners used cash to start their businesses.
Source: Guidant Financial
15. Businesses with female owners earned $142,900 on average in 2019.
Interesting data on statistics about female entrepreneurs from American Express report how much female-owned businesses earned in 2019. According to female entrepreneurship statistics 2019, they earned an average of $142,900. In comparison, all private businesses earned $474,900 on average in the same year.
Source: American Express

16. Communication skills (37%) were the number one reason for the success of female entrepreneurs.
When it comes to the percentage of successful entrepreneurs, the top factor for female entrepreneurs’ success was people and communication skills (37%). Furthermore, the second reason for success was self-discipline (34%). The third reason for success was money management skills.
Source: National Business Capital and Services
17. Women business owners invest 80 cents for every one dollar they get back.
According to Babson college women entrepreneurs statistics, women get one dollar back into their family for every 80 cents they invest in their business. Moreover, according to the same source, this is what brings the mortality rates down, and GDP up.
Source: Babson
18. In 2021, 31% of current and aspiring entrepreneurs are female.
According to Guidant Financial, 31% of current and aspiring entrepreneurs are female. This is a solid rise from 2020 when only 27% of current and aspiring entrepreneurs were female. On the other side, 66% are male.
Source: Guidant Financial
Black Female Entrepreneurs Statistics
19. In the US, 46% of black entrepreneurs are women.
According to Guidant Financial, out of all black business owners, 46% are women. This number is 53% higher than white small business entrepreneurs. This data for black female entrepreneurs statistics is from 2021.
Source: Guidant Financial
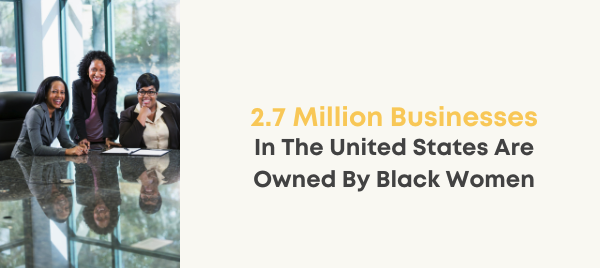
20. In the US, 2.7 million businesses are owned by African American or black women.
According to data from American Express for 2019, 2.7 million businesses in the United States are owned by black women. Moreover, black women make up for 42% of net new women-owned businesses.
Source: American Express
Male Entrepreneurs Statistics
21. Middle-aged men start the most successful businesses.
While many think that young people are on a good road to success when starting a business, statistics are showing different. According to MIT Sloan, entrepreneurs who start a business and hire at least one employee are 42 years old on average.
Source: MIT Sloan
22. 18.3% of men under the age of 65 started a new business in 2019.
Based on data from Babson’s Global Entrepreneurship Monitor, 2019 was a successful year for new businesses. For instance, in that year, 18.3% of men under 65 started a new business in the United States.
Source: Babson
23. In the US, 68% of small business owners are men.
According to a report from Guidant Financial for 2021, 68% of small business owners are men, while only 32% are women. While the number of female entrepreneurs is on the rise, male entrepreneurs are still a vast majority in the United States.
Source: Guidant Financial
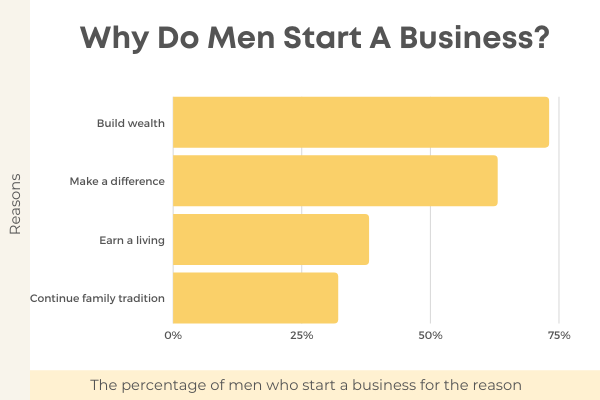
24. Around 63% of men start a business with a reason to make a difference in the world.
When Babson asked male entrepreneurs for a reason why they started their own business, here is what they said. More than six in 10 (63%) male entrepreneurs said they started a business to be able to make a difference in the world. Also, 73% of them said they started a business to make a lot of money or build wealth. Furthermore, 38% of men said they started a job to earn a living as jobs are scarce. Finally, 32% of men did it to continue the family tradition.
Source: Babson
Entrepreneur Age Statistics
25. Just under half (46%) of entrepreneurs are between 41 and 56 years old.
When it comes to the age of entrepreneurs, 46% of those who start a business are between 41 and 56 years old. This statistical data is according to the 2021 study by Guidant Financial. Moreover, this study interviewed 2,400 aspiring and current entrepreneurs.
Source: Guidant Financial
26. In the US, the average entrepreneur is 42 when they start a business.
According to the National Bureau of Economic Research, an average entrepreneur in the US is 42 years old when they start a business. Moreover, age varies in different industries. For example, the average age of those who start a business in the software industry is 40.
Source: National Bureau of Economic Research
27. In 2019, 16% of US entrepreneurs were between 18 and 24 when they started a business.
According to Babson’s Global Entrepreneurship Monitor, 16% of those between the age of 18 and 24 started a business in 2019. Moreover, so did 25% of those between the age of 25 and 34 and 22% of those 35 to 44. After that, so did 13% of those aged 45 to 54 and 55 to 64. Finally, even 6% of those aged between 65 and 74 started a new business in 2019.
Source: Babson
28. 67% of black entrepreneurs in the US belong to the generations of Millennials and Gen X.
In the United States, almost seven in 10 black entrepreneurs (67%) are Millennials or Generation X members. In comparison, so are 56% of all entrepreneurs in the country.
Source: Guidant Financial
29. Since 2017, the age of those starting a new business has dropped from 38 to 34 years old.
According to FreshBooks, those starting a new business were around 38 years old on average before 2017. However, since 2017, the average age of those starting a new business has dropped to 34 years old.
Source: FreshBooks

30. For the fastest-growing startups, the mean age of the entrepreneur founder is 45 years old.
According to the finding from the NBER Working Paper, the main characteristic of successful startup founders is not youth. When they analyzed the successful startups, they calculated the mean age of the founders to be 45 years old. Moreover, they usually have before-hand experience in the field where they are starting their business.
Source: NBER Working Paper
31. Entrepreneurs starting new businesses in their 20s are least likely to achieve success in the top 0.1% of growth.
Many connect successful businesses to young people. However, the statistics about entrepreneurs’ age are not in favor of those in their 20s. Moreover, statistics also show that those in their 20s are least likely to achieve success or be in the top 0.1% of growth.
Source: National Bureau of Economic Research
32. A 50-year old starting a business is 1.8 times as likely to reach a high growth rate than a 30-year old.
When it comes to the difference in entrepreneurs’ age, there is one interesting finding. A 50-year is 1.8 times more likely to reach a high growth rate than a 30-year old when starting a business.
Source: National Bureau of Economic Research
33. Out of all small business owners, 41% are Baby Boomers.
Out of all group ages, 41% of entrepreneurs are Baby Boomers. Moreover, 46% belong to Gen X. Also, 13% are Millennials, and 1% are Gen Z.
Source: Guidant Financial
34. Six in 1o of those who start a business are 40 to 60 years old.
Out of those who start a business, 60% are aged 40 to 60. This data comes from Guidant Financial who interviewed 2,400 new and aspiring entrepreneurs.
Source: Guidant Financial
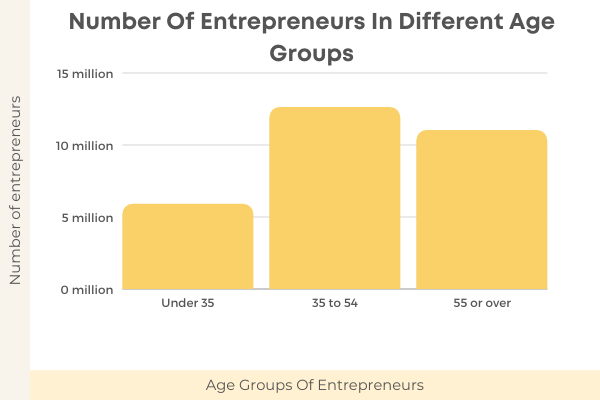
35. Out of all entrepreneurs, 5.88 million are under the age of 35.
While there are 5.88 million entrepreneurs under the age of 35, there are also 12.6 million of those aged between 35 and 54. Also, there are 11.01 million of those who are 55 or older.
Source: Office of Advocacy
36. The most common age range for entrepreneurs is 50 to 59 years old.
According to the data from National Business Capital & Services, there are 35% of entrepreneurs between 50 and 59 years old. As this is more than one in three entrepreneurs, this is the most common age group.
Source: National Business Capital & Services
Black Entrepreneurship Statistics
37. 67% of black entrepreneurs in the US are Millennials or Generation X.
According to entrepreneurs statistics, 67% of black entrepreneurs are Millennials or Generation X. This percentage of young black entrepreneurs is higher than the percentage of young business owners overall. In comparison, 56% of all entrepreneurs are Millennials or Generation X.
Source: Guidant Financial
38. Almost one in three black entrepreneurs (31%) in the US are Baby Boomers.
According to data from Guidant Financial, almost one in three black entrepreneurs (31%) are Baby Boomers. In comparison, 2% belong to the Silent Generation.
Source: Guidant Financial
39. Out of every 100,000, 240 black adults became entrepreneurs each month in 2019.
According to Kauffman Indicators of Entrepreneurship, 240 black adults out of every 100,000 became entrepreneurs each month of 2019. In comparison, so did 290 white adults and 310 Asian adults.
Source: Kauffman Indicators of Entrepreneurship
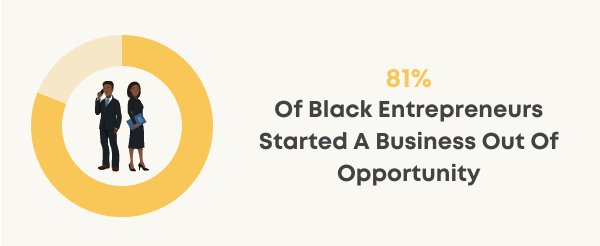
40. In 2018, 81% of black entrepreneurs started a business not out of necessity, but opportunity.
Based on the information from Kauffman Indicators for Entrepreneurship, 81% of black entrepreneurs in 2018 started a business not out of necessity, but opportunity. In comparison, so did 86% of white entrepreneurs, 85% of Latino entrepreneurs, and 92% of Asian entrepreneurs.
Source: Kauffman Indicators for Entrepreneurship
41. Out of all people of color entrepreneurs, black entrepreneurs are the largest group.
More than one in three (36%) of people of color entrepreneurs are black entrepreneurs. Moreover, the second largest group is Latino/Hispanic (24%). Asian-Americans make up 18%, and 10% are also mixed race.
Source: Guidant Financial
42. 20% of black entrepreneurs offer business services.
According to information from Guidant Financial, one in five black entrepreneurs offer business services (20%). Other popular industries include health, beauty, fitness, and food.
Source: Guidant Financial
43. 72% of black enterprises are profitable.
According to data for 2020, out of all black enterprises, 72% are profitable. In comparison, so are 78% of all businesses. This leads us to conclude that black enterprises are less profitable on average.
Source: Guidant Financial
Entrepreneurship Statistics Worldwide
44. The United States is the best country for entrepreneurs, with a Global Entrepreneurship Index of 83.6.
When it comes to the Global Entrepreneurship Index (GEI) for countries of the world, GEI shows that the US has the best climate for entrepreneurs and developing businesses. The US scored a GEI of 83.6. Furthermore, second on the list is Switzerland (80.4). Moreover, Canada, the UK, and Australia are next. Finally, Chad is at the bottom of the list with a GEI of just 9.
Source: GEI
45. The three best cities in the world for venture capital deals are San Francisco, New York, and London.
According to the Center for American Entrepreneurship, three cities in the world stand out as the best for venture capital deals. These cities are San Francisco, New York, and London.
Source: Center for American Entrepreneurship

46. The Republic of Korea has the lowest share of people who would not start a business because of fear of failure.
Babson’s Global Entrepreneurship Monitor listed countries in the world that would not start a business because of fear of failure. It turns out, the Republic of Korea has the lowest share of people (7%) who would not start a business as they are scared they would fail. After South Korea, Switzerland, the Netherlands, and Italy are the next in line.
Source: Babson
47. Worldwide, there are 582 million entrepreneurs.
According to the Global Entrepreneurship Monitor, there are 582 million entrepreneurs around the globe. This number is quite big and shows that entrepreneurship is well alive all around the world.
Source: Global Entrepreneurship Monitor
48. New Zealand is number one on the World Bank’s Ease of Doing Business Index.
According to the Ease of Doing Business Index from the World Bank, New Zealand ranked first in the world. The second and third place belongs to Singapore and Hong Kong, and Denmark is fourth.
Source: The World Bank
49. 18.7% of worldwide entrepreneurs are in a business with a family member.
According to data from 2019, almost one in five entrepreneurs around the world (18.7%) is in a business with a family member. This is particularly true in countries such as Colombia, the United Arab Emirates, as well as Uruguay. In these three countries, family businesses make up for more than one-third of all businesses.
Source: Global Entrepreneurship Monitor
50. It takes five days to start a business in the UK and Belgium, and four days in the US.
According to data from the World Bank, it takes but five days to start a business in the UK and Belgium. Moreover, it takes four days in the United States. Also, it takes two days in Canada, Australia, and Singapore, and only one day in New Zealand.
Source: The World Bank
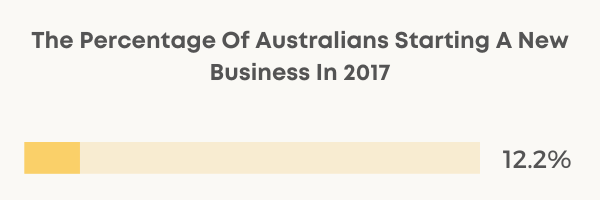
51. In 2017, 12.2% of the Australian adult population was starting a business.
Out of all Australians aged 18 to 64 years, 12.2% were starting a business or in the early stages of running a business in 2017. If you are wondering how many entrepreneurs in Australia are starting a business, the figures show it was around 1.8 million in 2017.
Source: Global Entrepreneurship Monitor
Entrepreneurship Growth Statistics
52. In 20 years, the number of female entrepreneurs has grown by 114%.
According to statistics from American Express, the number of female entrepreneurs has grown by 114% in the last 20 years. In comparison, at the same time, all businesses had a total growth rate of 44%.
Source: American Express
53. In some cases, those that start a business in a field where they have experience, are 125% more likely to achieve high growth.
According to the National Bureau of Economic Research, those with previous experience in a field where they want to start a business are more likely to achieve high growth. In some cases, they are 125% more likely to achieve high growth.
Source: National Bureau of Economic Research
54. Between 2011 and 2020, subscription businesses grew by over 435%.
According to interesting statistics from Zuora, subscription businesses grew by over 435% between 2011 and 2020. Among the subscription businesses, Netflix and meal boxes stand out. Moreover, subscription business is available in many enterprises, including music, gyms, websites, grocers, and more.
Source: Zuora
Millennial Entrepreneurs Statistics
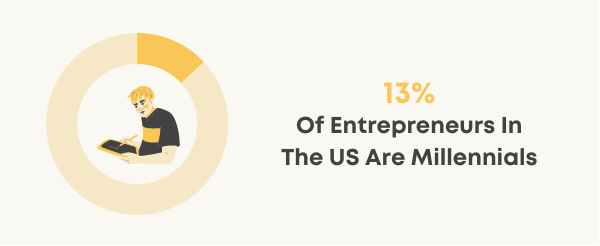
55. 13% of US entrepreneurs are Millennials.
According to a study including 2,400 current and aspiring small business owners in the US, 13% are Millennials. This data is from the statistics for 2021.
Source: Guidant Financial
56. 86% of Millennials do not think that the sole purpose of businesses should be making a profit.
When it comes to millennial leadership statistics, 86% of Millennials think that businesses should not be only making a profit. Instead, they should also be of service to the whole world.
Source: Deloitte
57. 28% of Millennial entrepreneurs are women.
More than a quarter of Millennial entrepreneurs (28%) are women. Moreover, this number is 12% higher than the national average. Women are also 22% more like to be Millennial entrepreneurs than Boomers.
Source: Guidant Financial
58. 53% of Millennial male entrepreneurs are very happy with their vocation.
When it comes to Millennial male entrepreneurs, the majority of them (53%) are very happy with their vocation. Moreover, they report their happiness on a scale of nine to 10 on a 10-point scale. On the other hand, female millennial entrepreneurs are not reporting to feel as happy.
Source: Guidant Financial
59. 52% of Millennial entrepreneurs are very happy as small business owners.
Including both female and male entrepreneurs from the Millennial generation, 52% of them report being very happy as small business owners. In comparison, so do 54% of Baby Boomers.
Source: Guidant Financial
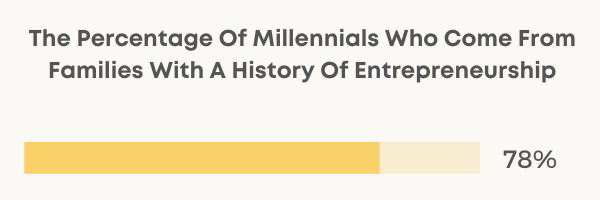
60. 78% of millennials come from families with a history of entrepreneurship.
According to Global Entrepreneurship Report, 78% of millennials come from families that have a history of entrepreneurship. And with a background of successful businesses, young people can learn about business and have access to the expertise and capital to start their businesses.
Source: Global Entrepreneurship Report
Youth Entrepreneurship Statistics
61. In 2013, young people were 23% of small business owners/entrepreneurs.
While only around one in five new small businesses (23%) were owned by young entrepreneurs in 2013, this number was higher in 1996. Back then, according to young entrepreneurs statistics, young people made for 35% of new entrepreneurs.
Source: Kauffman Foundation
62. Young people are starting twice as many businesses as the boomer generation.
According to the Global Entrepreneur Report from 2016, young people are starting twice as many businesses as members of the Baby Boomer generation. The Report included a survey of 3,000 multimillionaire entrepreneurs across 18 countries.
Source: Global Entrepreneur Report
63. Young people in their 20s and 30s are starting around 7.7 companies each on average.
Those who are in their 20s and 30s are starting way more businesses each than the older generation. According to Global Entrepreneur Report from 2016, young people in their 20s and 30s are starting 7.7 businesses each on average. In comparison, Baby Boomers over the age of 50 started 3.3 businesses or more.
Source: Global Entrepreneur Report
Entrepreneur Mental Health Statistics
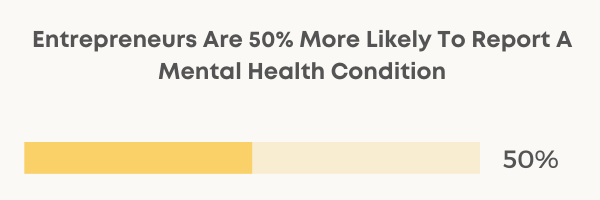
64. Entrepreneurs are 50% more likely to say they have a mental health condition.
According to research from Michael Freeman, entrepreneurs are more prone to having a mental health condition. They are 50% more likely to report they have a mental health condition.
Source: Michael Freeman
65. Entrepreneurs are ten times more likely to have bipolar disorder.
According to Michael Freeman’s findings, entrepreneurs are ten times more likely to suffer from bipolar disorder. Moreover, people with a creative and energetic side are more likely to be both entrepreneurial and have strong emotions, even including depression, suicidal thoughts, and more.
Source: Michael Freeman
66. Mental health affects 72% of entrepreneurs either directly or indirectly.
Out of that 72%, 49% of entrepreneurs had a personal mental health history, while 23% had a history of mental health in the family. This data comes from research from 2019.
Source: Small Business Economics
67. 11% of entrepreneurs are likely to have a bipolar disorder diagnosis.
According to the data published in Small Business Economics in 2019, 11% of entrepreneurs are likely to be diagnosed with bipolar disorder. In comparison, so are 4.4% of the general population and 1% of the comparison group.
Source: Small Business Economics
Entrepreneur Burnout Statistics
68. 8% of entrepreneurs suffered from burnout in 2018.
In 2018, 15.8 million Americans worked as entrepreneurs and, according to data, at least 8% of them suffered from burnout. This is not surprising as running a startup or a business can be quite demanding and tiring.
Source: Inc Entrepreneurship Index
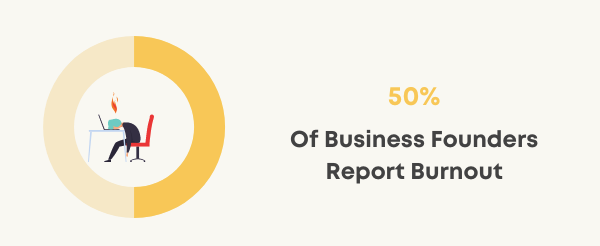
69. One in two (50%) business founders report feeling burnout.
According to an article on Business Insider, 50% of business founders report feeling burnout. Leadership burnout statistics show us that leaders and entrepreneurs feel burnout in many cases, with half of them reporting to feel burnt out. This is also the result of those who suffer from depression and report feeling the effects of depression on them.
Source: Business Insider
70. Almost half (45%) of entrepreneurs report feeling stressed.
Almost one in two entrepreneurs (45%) report feeling stressed, according to the Gallup Wellbeing Index. On the other hand, so do 42% of other workers. However, based on this data, entrepreneurs are more stressed than other workers. Meanwhile, they also worry more (34%) compared to 30% of other workers.
Source: Gallup
ADHD Entrepreneur Statistics
71. Almost one in three entrepreneurs (29%) are likely to experience ADHD.
Attention deficit hyperactivity disorder is a health condition that 29% of entrepreneurs are likely to experience. On the other hand, so are 5% of the comparison group in the 2019 research on mental health and entrepreneurs. Moreover, this is also much more than 4.4% of the general population.
Source: Small Business Economics
72. People with ADHD are three times more likely to have their own business.
According to research, those with ADHD are likely to be hyperfocused risk-takers who like to start their own business. Moreover, those who are diagnosed with ADHD, are three times more likely to own their own business.
Source: Media for Your Mind
73. Individuals with ADHD are 60-8% more likely to have entrepreneurial intentions.
According to research in Small Business Economics about the relations between entrepreneurship and ADHD, this is a very interesting finding. Those with ADHD are 60-80% (or 1.7 times) more likely to show significantly higher intentions for entrepreneurship.
Source: Small Business Economics

74. ADHD increases the odds of entrepreneurial actions by 100%.
Other data statistics also show that individuals with ADHD are more prone to starting their businesses. As a matter of fact, according to research from Small Business Economics, ADHD increases the chance of entrepreneurial actions by 100%.
Source: Small Business Economics
Entrepreneur Income Statistics
75. The average entrepreneur makes around $61,000 per year in the US.
According to the U.S. Census Bureau, an average entrepreneur in the US earns around $61,000 per year. Moreover, the income varies in different groups, as well as among races.
Source: U.S. Census Bureau

76. An average white entrepreneur makes $64,000 per year in the US.
Compared to the overall average US entrepreneur who makes $61,000 a year, an average white entrepreneur earns more. Namely, the yearly income of an average white entrepreneur in the US is $64,000. In comparison, a non-entrepreneur white person earns around $50,000 a year.
Source: U.S. Census Bureau
77. On average, a black entrepreneur earns $38,000 a year in the US.
According to the U.S. Census Bureau, an average black entrepreneur earns $38,000 every year. On the other hand, an average black person who is not an entrepreneur makes $35,000 per year.
Source: U.S. Census Bureau
78. The average Asian entrepreneur makes $63,000 annually.
According to the American Census, Asian entrepreneurs have an annual income of $63,000, almost the same as white entrepreneurs on average ($64,000). In comparison, Asian non-entrepreneurs make $58,000 every year on average.
Source: U.S. Census Bureau
79. An average Latino entrepreneur has an annual income of $36,000.
In the United States, an average Latino entrepreneur makes $36,000 every year. In comparison, average Latino people who are not entrepreneurs make $33,000 per year.
Source: U.S. Census Bureau
Entrepreneur Statistics UK
80. In 2020, the UK had 5.9 million small businesses.
According to FSB, the UK had 5.9 million small businesses in 2020. However, at the start of 2021, there were 5.5 million small businesses. The smaller number could be due to the COVID-19 pandemic.
Source: FSB

81. More than six in 10 UK workers want to start a business.
According to statistics from SME Loans, 64% of the UK’s workforce wants to become an entrepreneur and start a business. Out of those, 75.9% are based in London. Moreover, 4 in 5 of those individuals are members of Generation Z.
Source: SME Loans
82. In the UK, women lead 34% of small- and medium-sized enterprises.
One in three small- and medium-sized enterprises in the UK are led by women (34%). In comparison, in 2017, only 19% of small businesses were run by women.
Source: The HR Director
83. More than nine in 10 UK entrepreneurs are white.
According to data from Startups, the vast majority of the UK entrepreneurs are white (93%). This means that there are only 7% of ethnic minorities entrepreneurs in the country. However, this is still progress as there were only 5% of those in 2004.
Source: Startups
Entrepreneur Statistics Canada
84. Roughly, there are 3.5 million entrepreneurs in Canada.
In Canada, it is estimated there are 3.5 million entrepreneurs. They come from different industries and niches, according to Startup Canada.
Source: Startup Canada
85. Out of all Canadians, those aged 25 to 44 are most likely to start their own business.
When it comes to Canadians, younger generations are more likely to start their own business (25 to 44 years old). Furthermore, in 2018, younger generations made up about one-third of all entrepreneurial activity.
Source: BDC/ic.gc
86. More than four in 10 Canadian startups fail because their services/products are not needed.
According to data from FundSquire, 42% of Canadian startups fail because their products and services are not needed on the market. Moreover, 29% of them fail because they lack resources or means at some point. Also, some fail because they did not have the right team (23%), were outcompeted (19%), and more.
Source: FundSquire
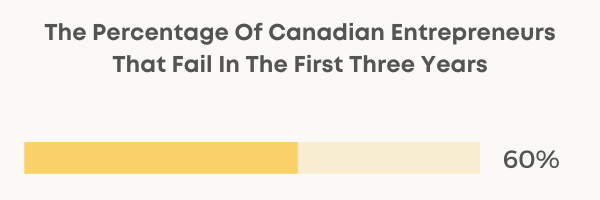
87. 20% of Canadian startups fail in the first year, and 60% in the first three years.
According to FundSquire, one in two Canadian startups (20%) fails in the first year, while 60% of them fail in their first three years of existence. In conclusion, startups in Canada have a high risk of failure.
Source: FundSquire
Entrepreneur Depression Statistics
88. Entrepreneurs are twice as likely to suffer from depression.
Another interesting finding from Michael Freeman says that entrepreneurs are also more likely to be susceptible to depression. In fact, they are twice as likely to suffer from depression.
Source: Michael Freeman
89. 30% of entrepreneurs are likely to be depressed, compared to 16.6% of the general population.
According to the research article published in Small Business Economics, 30% of entrepreneurs are likely to be depressed. On the other hand, so are 15% of the comparison group participants. In comparison, 16.6% of the general public is also likely to be depressed.
Source: Small Business Economics
Percentage Of Entrepreneurs That Fail And Succeed
90. One in five (20%) of new businesses fail during the first two years after opening.
According to the U.S. Bureau of Labor Statistics, 20% of new businesses fail during the first two years of opening. Moreover, the percentage of entrepreneurs that fail within the first five years is 45%. Furthermore, 65% fail during the first 10 years.
Source: U.S. Bureau of Labor Statistics
91. After one year, 80% of new businesses are still operating.
One year into the opening, the percentage of successful entrepreneurs is 80%. This is according to the Kaufmann Early Start-up Survival Rate. However, after five years, the survival rate falls to just 50%, according to the Bureau of Labor Statistics.
Source: Kauffman Indicators of Entrepreneurship
Final Verdict
In conclusion, entrepreneur statistics show us the state of entrepreneurship in the world, in different countries, across gender and races. Moreover, it shows us how successful different generations are in their entrepreneurial activities and how affected entrepreneurs are by mental health, depression, stress, and more. For anyone who is thinking about or planning to become an entrepreneur, these statistics can be of a lot of help.