
People become entrepreneurs in different years and stages of their lives.
Some are entrepreneurs in their early 20’s and some don’t go down this path until much later in their life.
So, what can entrepreneur age statistics tell us? They can help us understand the average age of entrepreneurs, which generations they belong to, and which age makes the most successful entrepreneurs.
Let’s start!
Key Entrepreneur Age Statistics
(Editor’s Pick)
- 56% of entrepreneurs starting a business are 41 to 56.
- The average age of an entrepreneur starting a business is 42.
- 46% of small business owners in the US are Gen X.
- 5.88 million entrepreneurs are under 35.
- The most common age range of entrepreneurs is 50 to 59.
17 Entrepreneur Age Statistics
1. More than four in 10 (46%) entrepreneurs are 41 to 56 years old.
According to Guidant Financial, 46% of all entrepreneurs are between 41 and 56 years old when they start a business. This data comes from a 2021 report that interviewed 2,400 aspiring and current entrepreneurs.
Source: National Bureau of Economic Research
2. The average US entrepreneur is 42 when they start a business.
While the age of those who become entrepreneurs varies in different industries, there is the average age of those who first start their business. According to the National Bureau of Economic Research, the average US entrepreneur is 42 when they start a business.
Source: National Bureau of Economic Research
3. In the US, 67% of black entrepreneurs are Millennials or Gen X.
The large majority of black entrepreneurs in the United States, i.e. 67%, are members of Millennials and Generation X. For comparison, so are 56% of all entrepreneurs in the United States.
Source: Guidant Financial
4. When they started a business in 2019 in the US, 16% of entrepreneurs were 18 to 24 years old.
According to Babson’s data for 2019, 16% of US entrepreneurs were between 18 and 24 years old when they started a business. Also, 25% of those who started a business in 2019 were between 25 and 34 years old. Moreover, 22% were between 35 and 44 years old. Finally, in 2019, 13% of those aged 45 to 55 and those aged 56 to 65 also started a business, along with 6% of those aged 65 and 74.
Source: Babson
5. The age of those starting a business has dropped from 38 to 34 years old since 2017.
According to FreshBooks, the age of those who are starting a business has dropped since 2017. Namely, up until 2017, the average age of those starting a business was 38 years old. Moreover, since 2017, the average age has dropped to 34 years old.
Source: FreshBooks

6. The average age of the entrepreneur founder is 45 years old for the fastest-growing startups.
According to the NBER Working Paper, the founders of the fastest-growing startups are 45 years old on average. Moreover, this means that youth is not the main characteristic of successful startups. The 45-year-olds who have founded the most successful startups, usually also have prior experience in the same field.
Source: NBER Working Paper
7. First-time entrepreneurs in their 20s are least likely to achieve success in the top 0.1% of growth.
It is very common to think that young entrepreneurs are very successful. However, this is mostly not the case, according to the entrepreneurs’ age statistics. As it turns out, those starting a business in their 20s are least likely to achieve success in the top 0.1% of growth.
Source: National Bureau of Economic Research
8. In the US, 41% of all small business owners are Baby Boomers.
Every four in 10 small businesses (41%) in the US have a Baby Boomer owner. Also, 46% of them belong to Generation X. Finally, 13% of them are Millennials and 1% are Gen Z.
Source: Guidant Financial
9. 60% of those who start a new business are 40 to 60 years old.
According to Guidant Financial, six in 10 of those who start a new business are between 40 and 60 years old. This is according to a study that interviewed 2,400 aspiring and current entrepreneurs.
Source: Guidant Financial
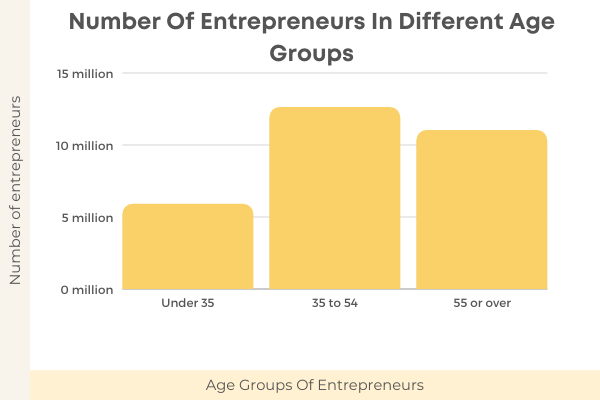
10. 5.88 million entrepreneurs are under the age of 35.
According to data from the Office of Advocacy, there are 5.88 million entrepreneurs under the age of 35. Also, 12.6 million are between 35 and 54 years old. Finally, 11.01 million are 55 years old or older.
Source: Office of Advocacy
11. The most usual age range for entrepreneurs is 50 to 59 years old.
According to statistics from Nation Business Capital & Services, 35% of entrepreneurs are 50 to 59 years old. As this is more than one-third of all entrepreneurs, it is the most common age scope for entrepreneurs.
Source: National Business Capital & Services
12. A 50-year-old is 1.8 times more likely to reach a high growth rate when starting a new business than a 20-year-old.
According to statistics, older entrepreneurs starting a new business are more likely to be in the top high-growth startups than young entrepreneurs. According to the National Bureau of Economic Research, a 50-year-old starting a business is 1.8 more likely to reach a high growth rate than a 20-year-old.
Source: National Bureau of Economic Research
13. New entrepreneurs starting a business in their 20s are least likely to achieve success or create a business in the top 0.1% of growth.
Out of all age groups starting a business, those who are new entrepreneurs in their 20s are least likely to achieve success. Also, according to the National Bureau of Economic Research, they are also least likely to create a business in the top 0.1% of growth.
Source: National Bureau of Economic Research
14. In 1996, there were 34.3% of entrepreneurs aged 20 to 34.
According to Statista’s data, there were 34.4% of entrepreneurs aged 20 to 34 in 1996. For comparison, this number fell to 25% in 2018.
Source: Statista
15. In 1996, 27.4% of entrepreneurs were 35 to 44 years old.
The number of those aged 35 to 44 fell between 1996 and 2018. For instance, in 1996, there were 27.4% of entrepreneurs of that age. In comparison, the number fell to 24% in 2018.
Source: Statista

16. The number of entrepreneurs aged 45 to 54 grew by 1.8% from 1996 to 2018.
According to Statista’s statistics, the number of entrepreneurs aged 45 to 54 grew between 1996 and 2018. In 1996, there were 23.5% of those aged 45 to 54. In comparison, in 2018, there were 25.3% of them.
Source: Statista
17. The number of entrepreneurs aged 55 to 64 grew by 11% between 1996 and 2018.
The group of entrepreneurs aged between 55 and 64 grew in number between 1996 and 2018. In 1996, there were 14.8% of them. In 2018, the number grew to 25.8%.
Source: Statista
Final Verdict
In sum, entrepreneur age statistics show that older entrepreneurs starting a business are more successful than younger generations. Moreover, the majority of entrepreneurs nowadays are Generation X members. Moreover, statistics about female entrepreneurs also give insight into the difference in the number of women and men entrepreneurs. Finally, entrepreneur statistics reveal how much entrepreneurs make on average, how many of them succeed, how many fail, etc.