
Once the rapid COVID-19 vaccine rollout started and countries opened up for international travel, the number of digital nomads began to rise.
The chances are, the number of digital nomads is going to grow in the future, too.
If you want to know about different digital nomad statistics, then this article is the one for you.
In the article, we will cover:
- the number of digital nomads,
- the age of digital nomads,
- how much they earn,
- what their professions are,
- how much they travel,
- how many hours they work,
- which challenges they encounter,
- and other interesting digital nomad statistics.
So buckle up and let’s get started!
Editor’s Pick Of Digital Nomad Statistics
- The number of digital nomads has doubled in 2 years.
- 19 million Americans plan to become digital nomads.
- 54% of digital nomads are over 38 years old.
- 38% of American digital nomads make over $75,000.
- 36% of digital nomads are freelancers.
- 54% of digital nomads visit 1 to 2 countries per year.
- 97% of digital nomads are COVID vaccinated.
The Number Of Digital Nomads Statistics
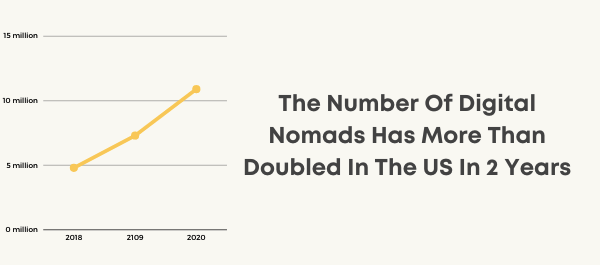
1. The number of digital nomads has doubled in the last two years in the US alone.
According to a report by MBO Partners, remote work statistics data show that the number of digital nomads in the USA more than doubled between 2018 and 2020. While there were 4.8 million digital nomads in 2018, that number more than doubled by 2020 when there were 10.9 million digital nomads in the United States.
Source: MBO Partners
2. The number of digital nomads around the globe amounts to 35,000,000.
According to this, if all digital nomads lived in just one country, it would rank in place number 41, after Canada and Morocco (in population).
Source: A Brother Abroad
3. US digital nomads make up 31% of all digital nomads worldwide.
Almost one-third (31%) of all digital nomads around the globe come from the United States of America.
Source: A Brother Abroad
4. 19 million Americans plan on becoming digital nomads in the next few years.
The future of digital nomadism looks bright. Why? While it is a growing trend for some years now, it is showing no signs of slowing down anytime soon. What is more, even the global pandemic did not impact it majorly. According to digital nomad stats, 19 million US residents plan to become digital nomads in the next two to three years.
Source: MBO Partners
The Age Of Digital Nomads Statistics
5. The average age of a digital nomad is 32 years old, and the majority are male.
According to data, there are 59% of male digital nomads, as opposed to 41% female. Moreover, the average age of a digital nomad is 32 years old. This tells us that they are neither very young, but also nowhere near being old. However, digital nomads do represent all age groups and all ethnicities, as well.
Source: Fiverr
6. 42% of digital nomads are Millennials, while 17% are Baby Boomers.
It comes as no surprise that the Millennial generation has a lead in digital nomads, making up for 42% of them. On the other hand, Baby Boomers make up only 17% of digital nomads in the US. Moreover, 22% of digital nomads belong to Gen X, and 19% to Gen Z.
Source: MBO Partner
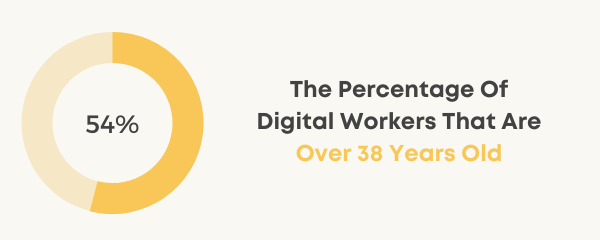
7. 54% of digital nomads are over 38 years old.
While the overage age of a digital nomad is around 32 years, 54% of them are actually over 38 years old.
Source: MBO Partners
8. Around six in 10 digital nomads started nomadistic life in their 20s, while 39% started at 30 or older.
Around 61% of digital nomads who were surveyed by A Brother Abroad answered that they started their digital nomad lifestyle in their 20s. The rest started at 30 or later.
Source: A Brother Abroad
9. While 70% of American digital nomads are white, 14% are African-American.
Out of all the digital nomads in the US, seven in 10 are white, 14% are African-American, 7% are Hispanic, 7% Asian, and 2% belong to other ethnicities.
Source: MBO Partners
10. 61% of digital nomads are married, while the rest are single or divorced.
It is interesting to see that most of the digital nomads are married, despite living the nomad lifestyle. Out of the 61% that are married, 31% travel with their spouses full-time. On the other hand, 38% do it part-time.
Source: FlexJobs
11. 26% of digital nomads have children aged 18 or under.
Out of all digital nomads who have children, 41% report that they travel with them.
Source: FlexJobs
How Much Do Digital Nomads Earn?
12. 20% of digital nomads earn between $50,000 and $99,999 a year.
So, 1 in 5 digital nomads makes more money than an average worker in the US. This also explains while digital nomadism is on the rise, as it offers both flexibility and better pay, among other things. Moreover, on average, digital nomads make between $10 and $30 an hour.
Source: FlexJobs
13. Around 38% of American digital nomads make $75,000+ annually.
According to MBO Partners digital nomad statistics, around 4.1 million American digital nomads earn over $75,000 per year. And even those who make less than that can find a way to save most of it. How? Well, digital nomads usually travel around the world, settling in affordable locations for several months.
Source: MBO Partners
14. The average annual budget of digital nomads is $22,499.
According to data from A Brother Abroad, digital nomads spend $1,875 a month on average, making it $22,499 yearly.
Source: A Brother Abroad

What Are Digital Nomads’ Professions?
15. 22% of digital nomads are software engineers, 13% are writers, and 9% are consultants.
Software engineering jobs seem to be the most popular among digital nomads, with many other jobs that allow them to travel freely around the world while working.
Source: Digital Nomad Help
16. Most digital nomad men work in software development (32%), and most digital women in the creative industry (17%).
Besides that, 29% of men are startup founders, and 16% of women work in marketing.
Source: Nomad List
17. In 2018, 35% of digital nomads were employed by companies, 28% were self-employed, and 18% owned a business.
In comparison, in 2017, only 19% of digital nomads were employed by companies.
Source: Digital Nomad Help
18. 83% of independent workers work remotely at least some of the time, while 37% work remotely full-time.
As they are independent, it makes sense that so many workers are doing remote work at least some of the time (83%), or even full-time (37%).
Source: Digital Nomad Help
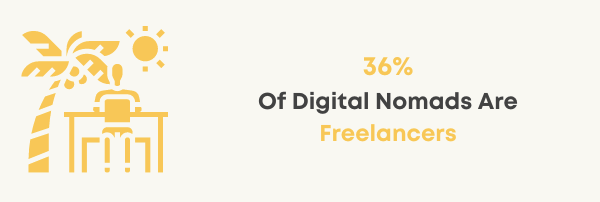
19. 36% of digital nomads are freelancers, while the others occupy a wide range of professions.
Only around one-third of all digital nomads work as freelancers for different clients and companies. The rest have many different professions, including business owners, consultants, designers, creatives, engineers, etc. What is more, thirty-three percent of them own their own business.
Source: ATTA
20. 37% of digital nomads have a graduate degree, while 26% have an undergraduate degree.
Moreover, around 30% of digital nomads do not have higher education, and 7% have a Ph.D. or MD.
Source: A Brother Abroad
How Much Do Digital Nomads Travel?
21. Just 24% of digital nomads travel and work simultaneously.
While digital nomads choose this kind of lifestyle because it allows them to travel and work at the same time, only 24% of them go through with it. Indeed, digital nomads do travel, but most of them do not do it at the same time they are working. Moreover, nine percent work abroad permanently, and eight percent alternate between domestic and international locations.
Source: Fiverr
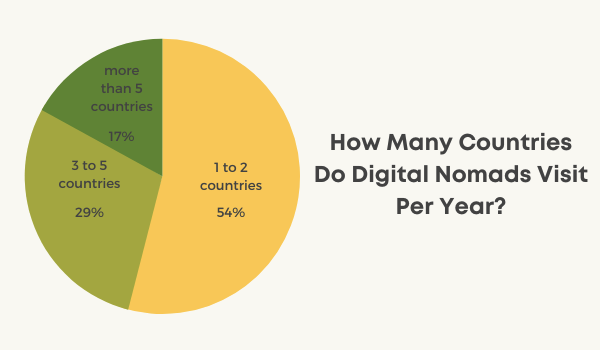
22. Out of those who travel while working, 54% usually visit one to two countries in the same year.
While the majority of those who travel and work at the same time visit between one and two countries, some do manage to squeeze in more traveling than that. As a matter of fact, according to research, 29% of digital nomads who travel while working visit three to five countries a year. Additionally, those who visit more than 5 countries a year make up only 17% of digital nomads.
Source: Fiverr
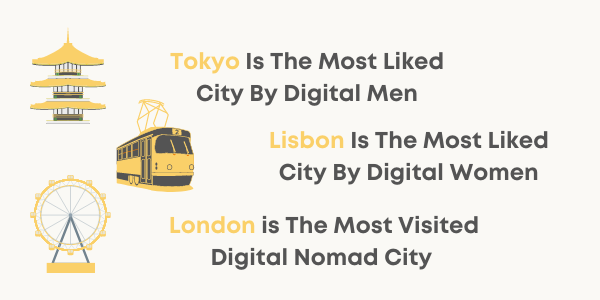
23. Tokyo is the city most liked by digital men, while digital women like Lisbon the best.
Tokyo scored a 4.8 rating by men, while Lisbon scored a 4.6 rating by women on Nomad List. Chiang Mei is second on the list of the best cities for digital men, while London finds itself in second place for digital women. Moreover, London is the most visited city for both men and women, according to Nomad List.
Source: Nomad List
24. Japan, Croatia, and Serbia are the three most liked countries for digital nomads.
According to Nomad List data, Japan scores a 4.9 rating, followed closely by Croatia (4.85). Serbia has the third-best rating of 4.8, along with Australia and Russia.
Source: Nomad List
25. 41% of digital nomads traveled less due to COVID-19, and 40% traveled only close to home and families in 2020.
Digital nomadism had its fair share of challenges due to the Coronavirus pandemic. For instance, 41% of digital nomads reported traveling less due to it in 2020.
Source: MBO Partners
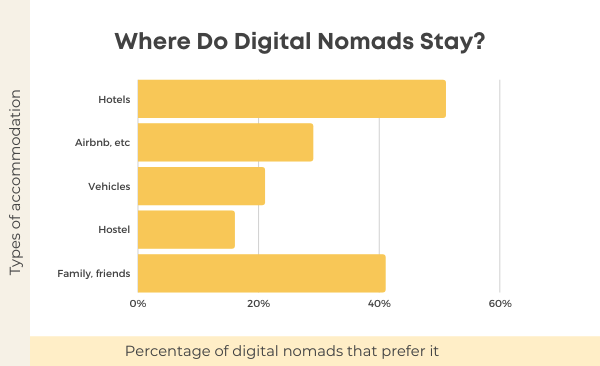
26. When traveling, 51% of digital nomads live in hotels and 36% rely on Airbnb and similar.
While five in 10 live in hotels when traveling, 36% choose Airbnb and similar services, 21% prefer vehicles, 16% stay in hostels, and 41% even stay with family or friends.
Source: FlexJobs
How Much Do Digital Nomads Work?
27. 4% work less than 10 hours a week, while 70% work 40 hours or less per week.
Digital nomads have the luxury of choosing when they do work, but that still does not mean they work any less. However, a FlexJobs study found that 70% of digital nomads work 40 hours per week or less. Moreover, 28% reported they work between 20 and 40 hours weekly. At the same time, 4% work under 10 hours a week.
Source: FlexJobs
What Are Digital Nomads Challenged By?
28. Finding reliable WiFi is the biggest challenge of the nomadic lifestyle for 52% of digital nomads.
When traveling, especially in third-world and undeveloped countries, digital nomads mostly struggle with finding strong Wifi connections they can use for telecommuting. Besides that, they also reported the challenge of communication and working with colleagues in other time zones.
Source: FlexJobs
29. When it comes to nomadic remote work, the biggest challenges are communication (27%), social opportunities (16%), loneliness and isolation (13%).
According to a digital nomad statistics report from 2020, digital nomads mostly struggle with communication (27%). However, they also report challenges such as time zones (9%), organic interaction (9%), and meetings (9%), among other things.
Source: Nira
Other Interesting Digital Nomad Statistics
30. Melbourne has been voted the most livable destination on the Work-From-Anywhere Index.
While there are many locations that could prove to be the best cities for digital nomads, Melbourne stands out as it scored the highest in costs and infrastructure, legislation, and livability. However, Thailand, Mexico, and many other Asian countries are also very popular among digital nomads due to lower costs.
Source: Nestpick
31. Out of all the American digital nomads, 17% make up those who live in vans.
As digital nomads work from anywhere, 17% of them (1.9 million) are actually those who have joined the Van-Life movement.
Source: MBO Partners
32. 30% of digital nomads have been living the lifestyle for over 10 years.
Almost one in three digital nomads have been on the road for over 10 years, with 50% of them traveling for four years or less. On average, digital nomads have been traveling for 6.1 years, according to the same research.
Source: A Brother Abroad
33. 96% of digital nomads would gladly recommend the lifestyle to a friend.
More than nine in 10 digital nomads (96%) would recommend this type of lifestyle to a friend, which just shows how happy they are with being nomads.
Source: MBO Partners
34. There were over 22,400 coworking spaces around the globe in 2019.
As this number has surely grown since 2019, it just shows that the number of digital nomads is rising as well, as they love to use coworking spaces around the world while traveling to get work done. The highest growth of coworking spaces is evident in London and New York, with China becoming one of the fastest-growing markets for them.
Source: MBO Partners
35. 74% of digital men eat meat, while 47% of digital women don’t.
According to interesting data from Nomad List, 5% of digital nomads are pescetarian, 13% vegan, and 12% vegetarian. Moreover, 26% of digital men do not eat meat, while 53% of digital women do.
Source: Nomad List
36. The majority of digital nomads work out by hiking (52% of men, and 55% of women).
To work out, 52% of digital men and 55% of digital women like to hike. Moreover, 51% of women like to do yoga, while 47% of men who are digital nomads like fitness.
Source: Nomad List
37. 97% of digital nomads are COVID vaccinated.
This is not surprising as COVID vaccination is necessary to travel. Only 3% of digital nomads are not COVID vaccinated, according to the same report.
Source: Nomad List
38. 43% of digital nomads report flexibility as the best benefit of the digital nomad lifestyle.
Digital nomads like this lifestyle best because they can choose to be flexible with their work, schedule, and their responsibilities.
Source: Nomad Girl
39. Digital nomads report feeling happy as 81% are highly satisfied and 9% are satisfied with their job and lifestyle.
Feeling satisfied with a job and lifestyle is something every individual strives for. Well, digital nomads are successful in this, as 90% of them are highly satisfied or satisfied with their job and nomadic lifestyle.
Source: MBO Partners
Conclusion
Digital nomadism is a trend that keeps on growing. While it does not surprise us that the numbers are so rapidly growing, we are excited to see what the future holds for this exciting, and quite frankly, admiring bunch. Once travel becomes even safer again, maybe many more will be encouraged to travel and work without the need to come home, as they are the true representation of remote workers. If you would like to read remote worker statistics, check them out on our site, too.